Solar eclipses present a truly unique opportunity to study the effects of a supersonic cooling shadow and its modulation of the structure and energetics of the ionosphere-thermosphere system. Atmosphere Perturbation around Eclipse Path (APEP) is a comprehensive sounding rocket campaign designed to study these eclipse dynamics. The mission name takes inspiration from the serpent deity Apep from ancient Egyptian mythology. Apep is the nemesis of the Sun deity Ra and is said to have pursued him and, every so often, nearly consumed him, resulting in an eclipse.
APEP is an eclipse rocket campaign that launched three rockets from White Sands Missile Range during the October 2023 annular eclipse and will launch three rockets from the Wallops Flight Facility during the April 2024 total eclipse. This campaign will be the first simultaneous multipoint spatio-temporal in-situ observations of electrodynamics and neutral dynamics associated with solar eclipses. For each eclipse, the first of the three instrumented rockets will be launched 35-45 minutes before peak local eclipse, the second at peak local eclipse, and the third 35-45 minutes after peak local eclipse. The launches will be supported by comprehensive ground-based observations through digisondes, meter wind radar, ISR, as well as high-altitude balloon launches to see meteorological forcing from below Observations will be used to constrain comprehensive modeling during data analysis.
Chimonas in 1970 postulated that an eclipse shadow can result in internal gravity waves which then show bow-wave patterns in Traveling Ionospheric Disturbances (TIDs) in the ionosphere. The eclipse-induced ionospheric irregularities have been a topic of interest since then, and the recent total solar eclipse of 2017 provided the community with an opportunity to obtain important ground- and space-based measurements to assess the impact of the eclipse, such as the generation of large scale TIDs published by Coster et al. 2017.
If one thinks of the ionosphere as a pond with gentle ripples, the eclipse is like a motorboat that suddenly rips through the water. This creates a wake immediately underneath and behind it, and the water level momentarily goes up as it rushes back in. This is visualized in a differential TEC map presented by Mrak et al. in 2018, which shows normal ‘ripples’ in dTEC existing before the 2017 eclipse and then the eclipse streaking across the continental USA.
In addition to the above studies, the temperature and density gradients resulting from eclipse can seed instabilities such as the Temperature Gradient Instability and Gradient Drift Instability. With the right conditions, these mechanisms can seed irregularities in scales of a few meters to 100s of meters that can cause scintillation of radio signals, which cannot be captured with large-scale simulations currently used by the community. Physical processes perturbed by eclipse extend well beyond the maximum period of totality into the penumbra [Goncharenko et al. 2018], appear across vast geographical expanses [Coster et al. 2017] and disrupt communication paths.
Given that solar eclipses of any type (total, annular, or partial) occur only about twice every year at some point over the Earth, opportunities to study them and their effects on the ionosphere thermosphere systems are limited due to limitations of comprehensively instrumented remote sensing sites along the path of the eclipse. Even rarer is the passage of an eclipse over/near a NASA sounding rocket launch site.
The passage in October 2023 of an annular eclipse almost overhead White Sands Missile Range, and the passage in April 2024 of a total solar eclipse in relative proximity of Wallops Island, presents a compelling opportunity to perform simultaneous multipoint in-situ measurements at extremely fine spatial scales supported by myriad ground-based remote sensing instrumentation. This should provide crucial insight in understanding and modeling the physical processes associated with eclipses that result in ionospheric and thermospheric disturbances. The next similar opportunity from the U.S. mainland is in 2045.
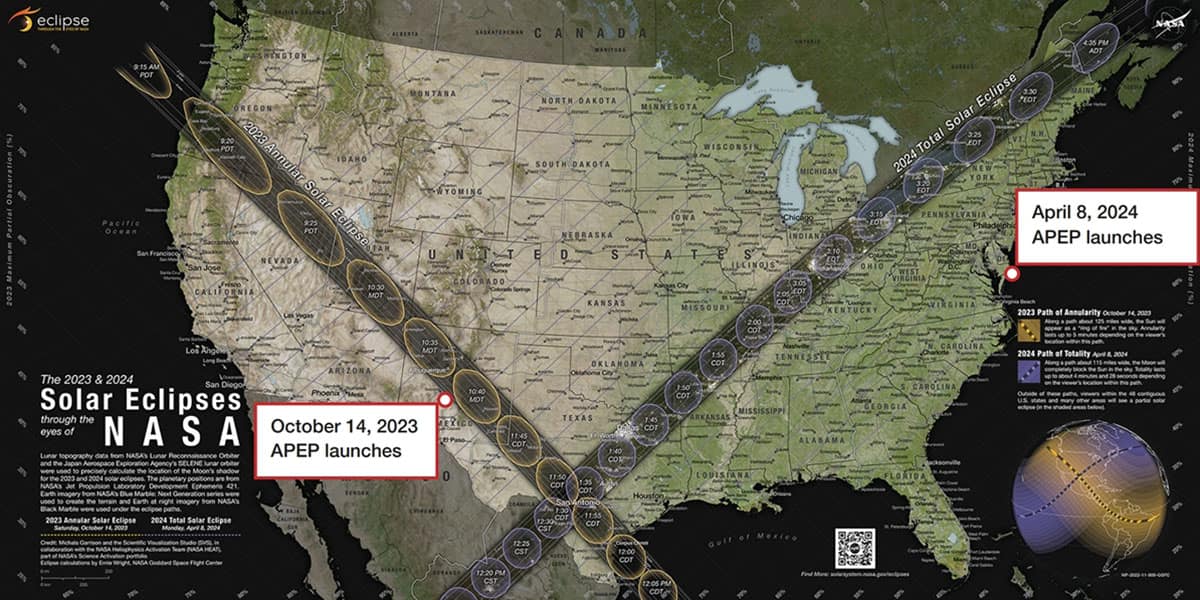
The paths of the upcoming eclipses with the launch locations of White Sands Missile Range and Wallops Flight Facility pin-pointed. Map Credits: Michala Garrison and the Scientific Visualization Studio (SVS), in collaboration with the NASA Heliophysics Activation Team (NASA HEAT), part of NASA’s Science Activation portfolio; eclipse calculations by Ernie Wright, NASA Goddard Space Flight Center. Rocket Location Marking Credit: Berit Bland/NASA
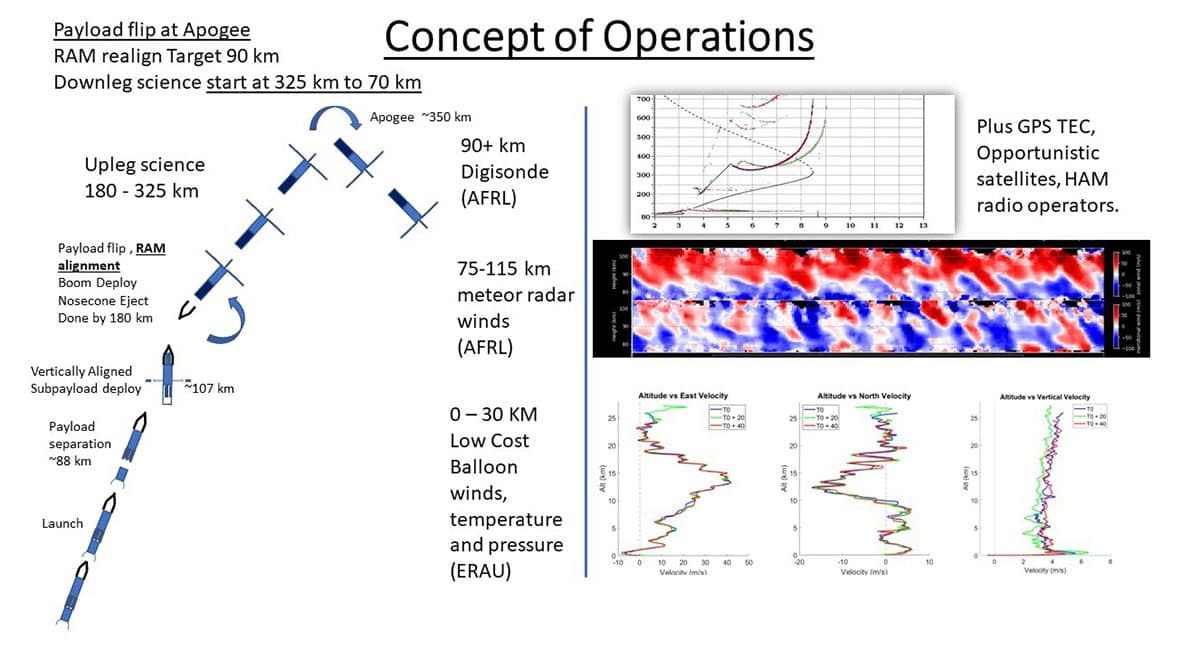
After the launch, the subpayloads get deployed at ~107 km at ~3 m/s ejection velocity. As all four move orthogonally away from the main payload, the payload flips, ejects the nosecone, deploys the booms and begins science measurements at 180 km upleg Altitude. The science measurements pause at 325 km altitude and the rocket flips to align into downleg RAM direction. The science measurements then continue until 70 km downleg, all the while the Subpayload continues moving away horizontally but in a parallel parabolic arc.
While the rocket measurements are going on, the ERAU team will release high-altitude balloons every 20 minutes starting two hours before peak eclipse (roughly 8:30 a.m. local time) and continuing until two hours after peak eclipse (12:30 p.m. local time). The ground station is able to track up to six balloons simultaneously, and the lifetime of each balloon is about two hours. The peak altitude achieved is about 28-30 km. This will give lower atmosphere winds and temperature. Co-investigator institution Air Force Research Lab will do continuous measurements of mesosphere winds (75-110 km) as well as ionosphere measurements using multiple ionosondes. These large-scale, ground-based measurements will be coupled with in-situ, small-scale measurements to feed into the modeling studies that are being led by CU Boulder (now JHU APL) and ERAU scientists. We will also be bringing in measurements from the larger science community as well as GPS TEC maps.
| Traceability Matrix | |||
|---|---|---|---|
| Science Questions | Measurement Requirement | Expected Instrument Performance | Mission Functional Reg |
|
Q1: Does the eclipse shadow directly seed discernible irregularities in the mid-latitude ionosphere? What are their length and time scales? Q2: What are the impacts of density, temperature and conductivity gradients in seeding small-scale (10s of meters to kilometers) ionospheric irregularities in the presence of solar eclipse? Q3: How do the different layers of the ionosphere behave differently in response to the overall cooling effect of the thermosphere? |
Magnetic Fields:
In-situ Plasma Density:
Electron/lon Temperature:
E-fields:
Neutral Density: |
Magnetometer:
Langmuir Probe Suite:
Electron/lon Temperature:
Electric Field Probes: lonization gauge measurements down to 1e-7 torr with a <20% sensitivity in pressure variation. |
Three rockets launched in various phases of the eclipse. One before max obscuration, one at peak obscuration and one much later. Each instrumented rocket ejects up to four instrumented subpayloads to measure simultaneous plasma density variations. Recovery of instrumented payload in WSMR for relaunch at Wallops. |
The above image lists the three specific science questions that the mission is trying to address. In order to do so we drive ourselves with some physical quantity measurement requirements and then select instruments that achieve those requirements for flight aboard the rockets. Furthermore, there are some mission requirements necessary to achieve the spatio-temporal variability.
The three rockets from WSMR in New Mexico were successfully launched. The results were presented at AGU2023 conference in San Francisco. After initial data analysis, there seem to be clear indications of small-scale irregularities in the bottom side of the F region, where a steep drop in plasma density was observed. The picture of the entire NASA and science team is shown below with two rockets on the rail in the background. The YouTube video of the three launches from WSMR is also embedded below.
